Link-Live™
Platform for Team Collaboration, Reporting, and Analytics

Link-Live™
Platform for Team Collaboration, Reporting, and Analytics
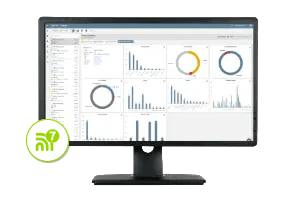
Link-Live offers powerful, interactive discovery and WiFi dashboards with integrated workflows that include flexible drilldowns for rapid problem resolution and efficient investigations. With unified reporting, advanced topology mapping, analysis, and data management Link-Live ensures teams can efficiently collaborate and share your networks status with all key stakeholders.
This network analysis tool also includes WiFi and Bluetooth/BLE site survey heat mapping capabilities. The AirMapper™ Site Survey app for the AirCheck® G3, EtherScope® nXG, and CyberScope® allows you to quickly and easily gather location-based Wi-Fi and Bluetooth/BLE measurements, and then create visual heat maps of key performance metrics in the Link-Live network analysis tool.
Key Features
-
Seamless Collaboration
Link-Live dashboards, workflows, and network analysis tools facilitate smooth collaboration between unlimited onsite team members and remote experts or external clients, without any licensing costs.
-
Heatmap Generation*
Generate WiFi and Bluetooth/BLE heatmaps using information collected with the AirMapper Site Survey App on EtherScope nXG, AirCheck G3, CyberScope, and CyberScope Air.
-
Problem Identification*
As a network analysis tool, Link-Live can be used to identify common WiFi network issues swiftly with the use of the InSites intelligence.
-
Network Mapping*
Generate a topology map of your wired and WiFi networks using discovery data from devices such as AirCheck G3, EtherScope nXG, CyberScope, CyberScope Air, LinkRunner AT 4000, or LinkRunner 10G.
-
Advanced Asset Management
The platform enables the linking of serial numbers of installed equipment or cable/wall jack labels to specific tests, optimizing asset management.
-
Simplified Reporting*
Link-Live makes it easier to generate reports and minimizes results management overhead for multiple testers and users.
*Active AllyCare Premium Support required for full AirMapper visualizations and filtering, automatic problem identification via InSites™ intelligence, comprehensive topology mapping, advanced reporting options in Link-Live, and web remote control.
How to use a network analysis tool?
Test it yourself and see how easy it is to use the Link-Live network analysis tool. Click on the orange dots to explore.
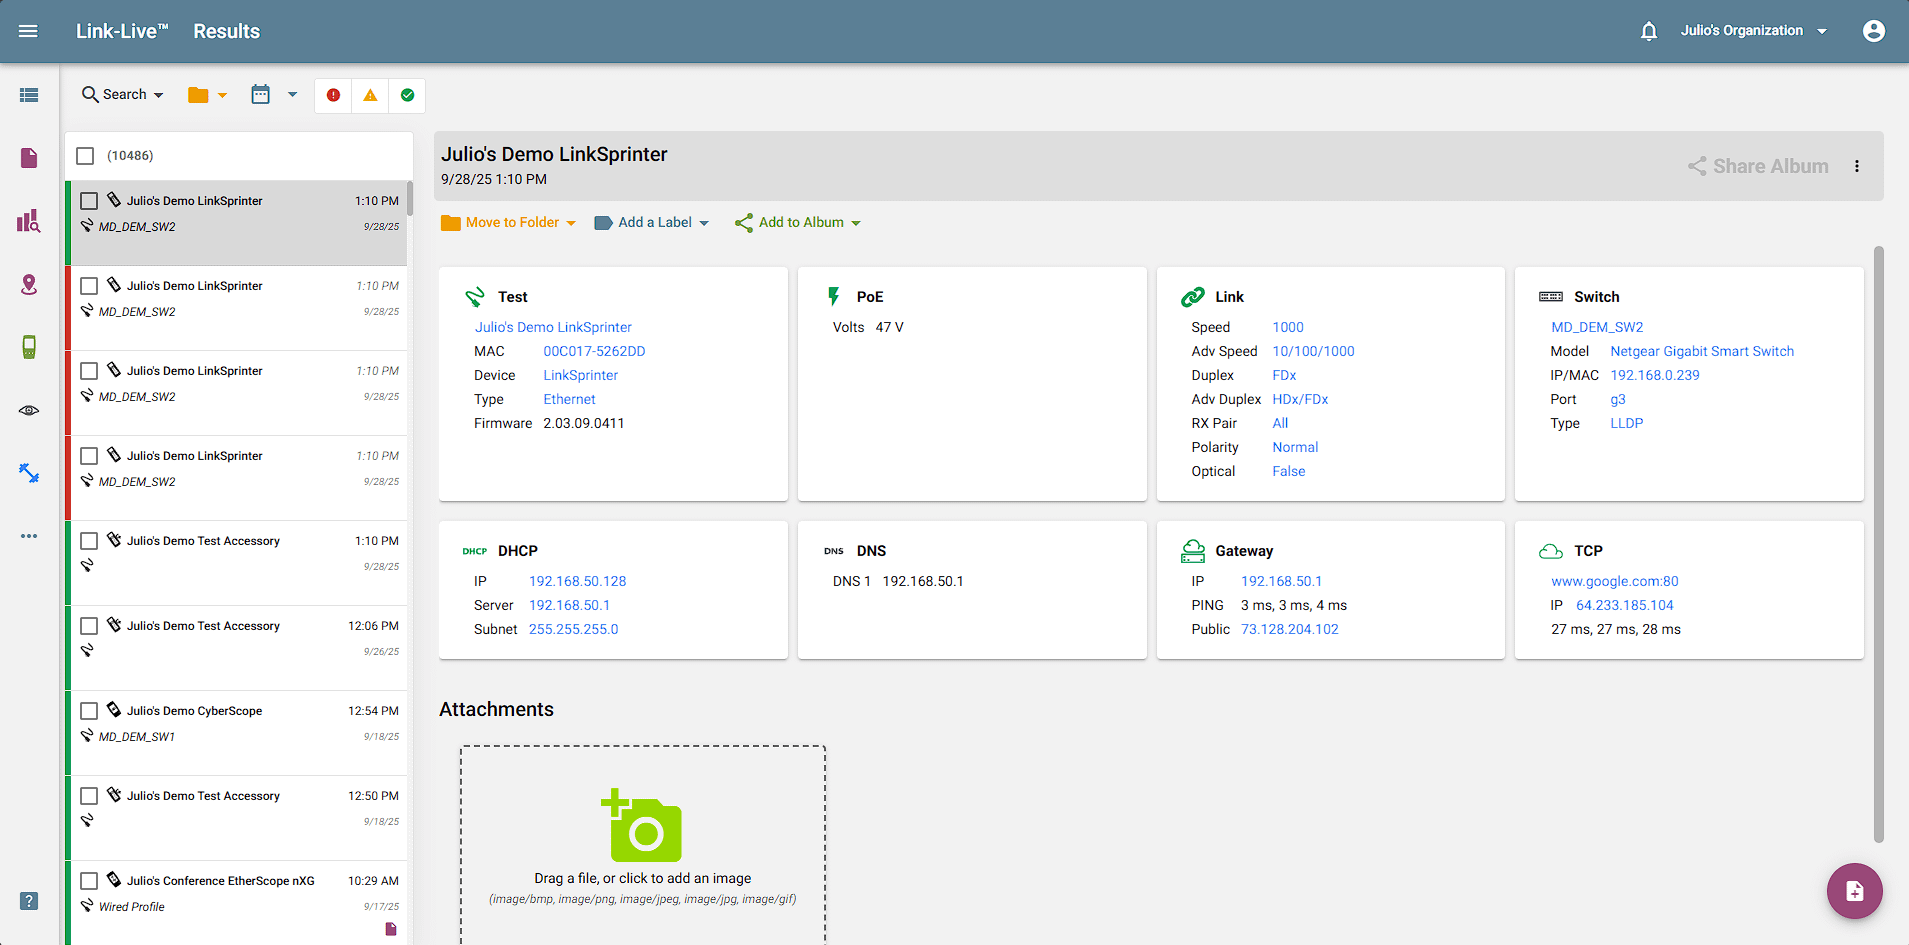
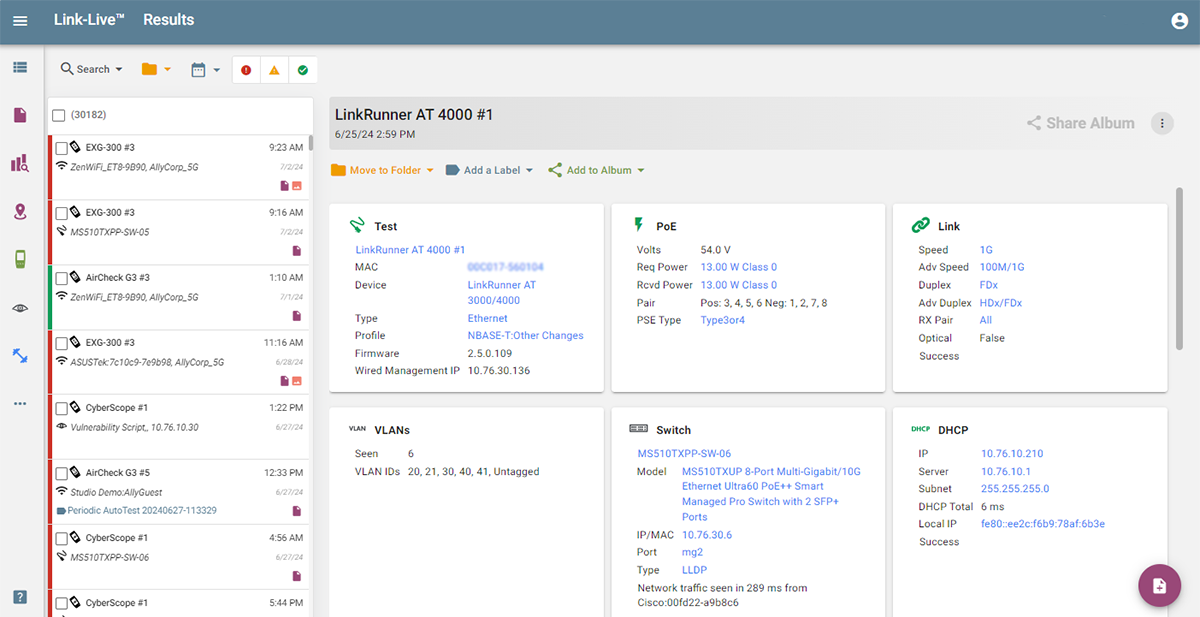
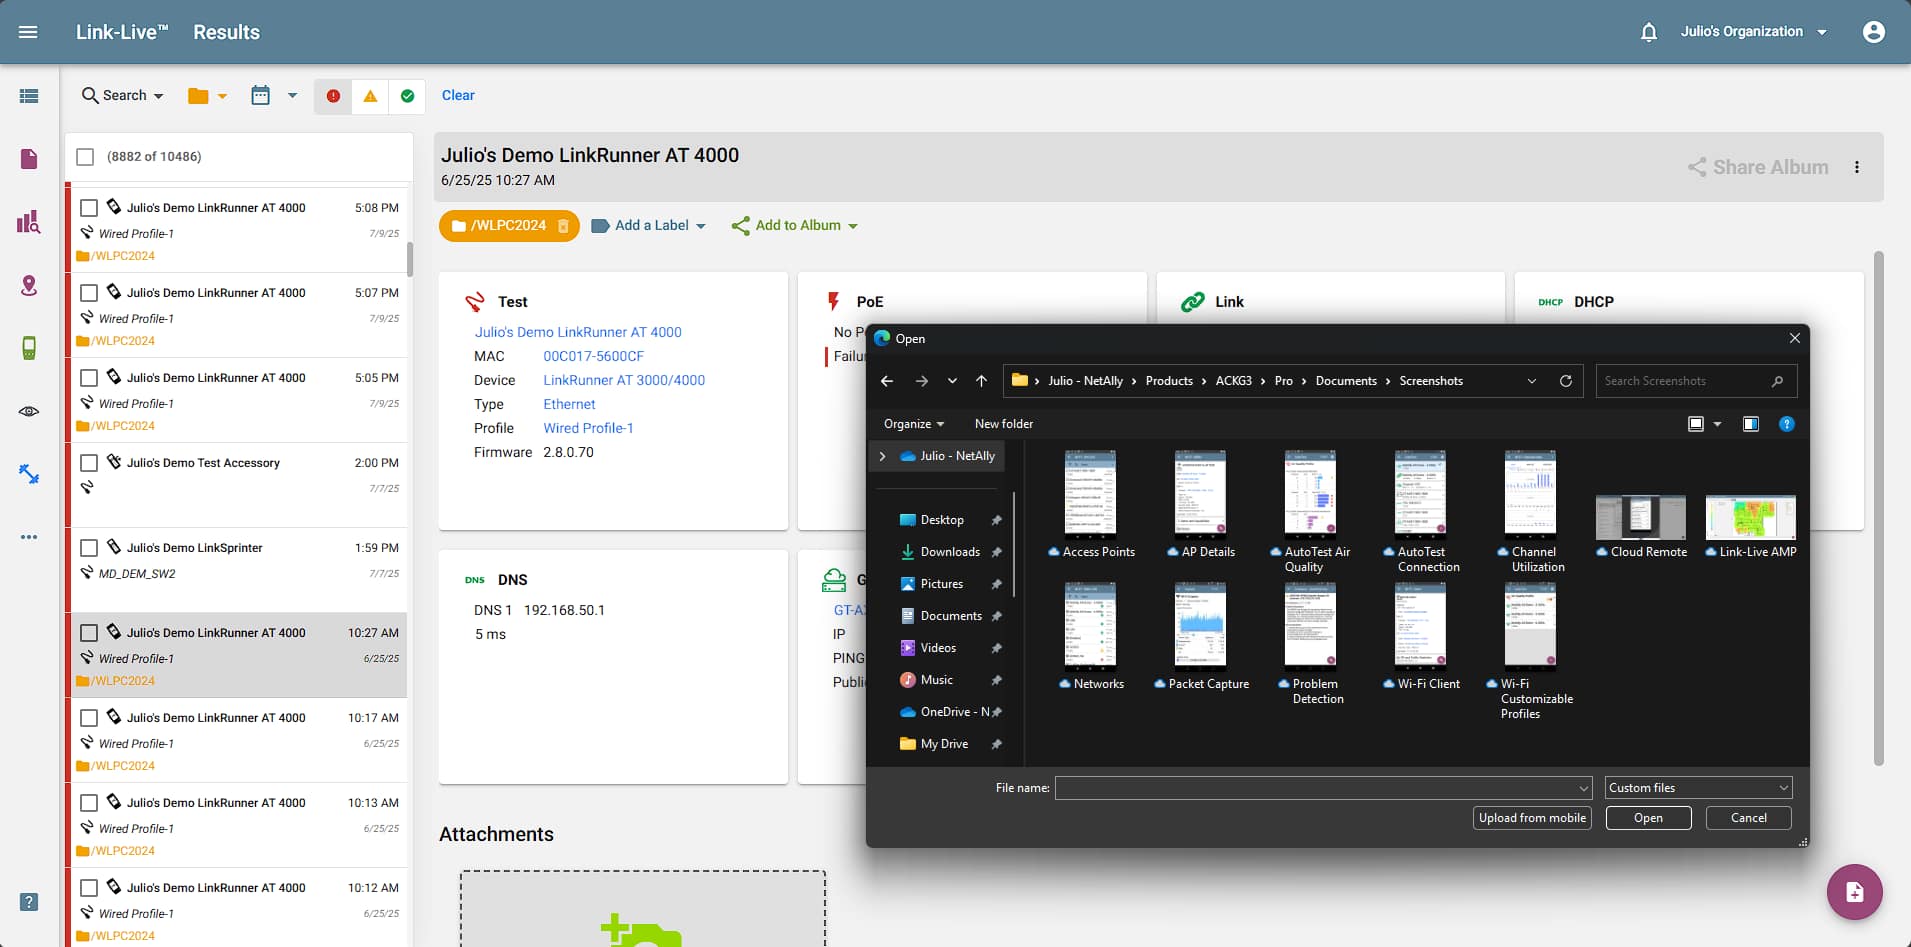
Result Dashboard
Screen: This is the Link-Live Results dashboard, where all your test results are uploaded. On the left, results are displayed with the unit’s name, data, and time of test, along with the test type and any folders or labels applied to the result. Users can navigate and access other functions of Link-Live using the left panel.
Benefit: This allows you to easily consolidate all test results, reporting, and data management in a secure cloud portal from all your NetAlly Handheld Network Testers. Link-Live improves staff efficiency, enabling you to easily manage network changes, document your networks, and collaborate with site personnel and remote experts or with external clients.
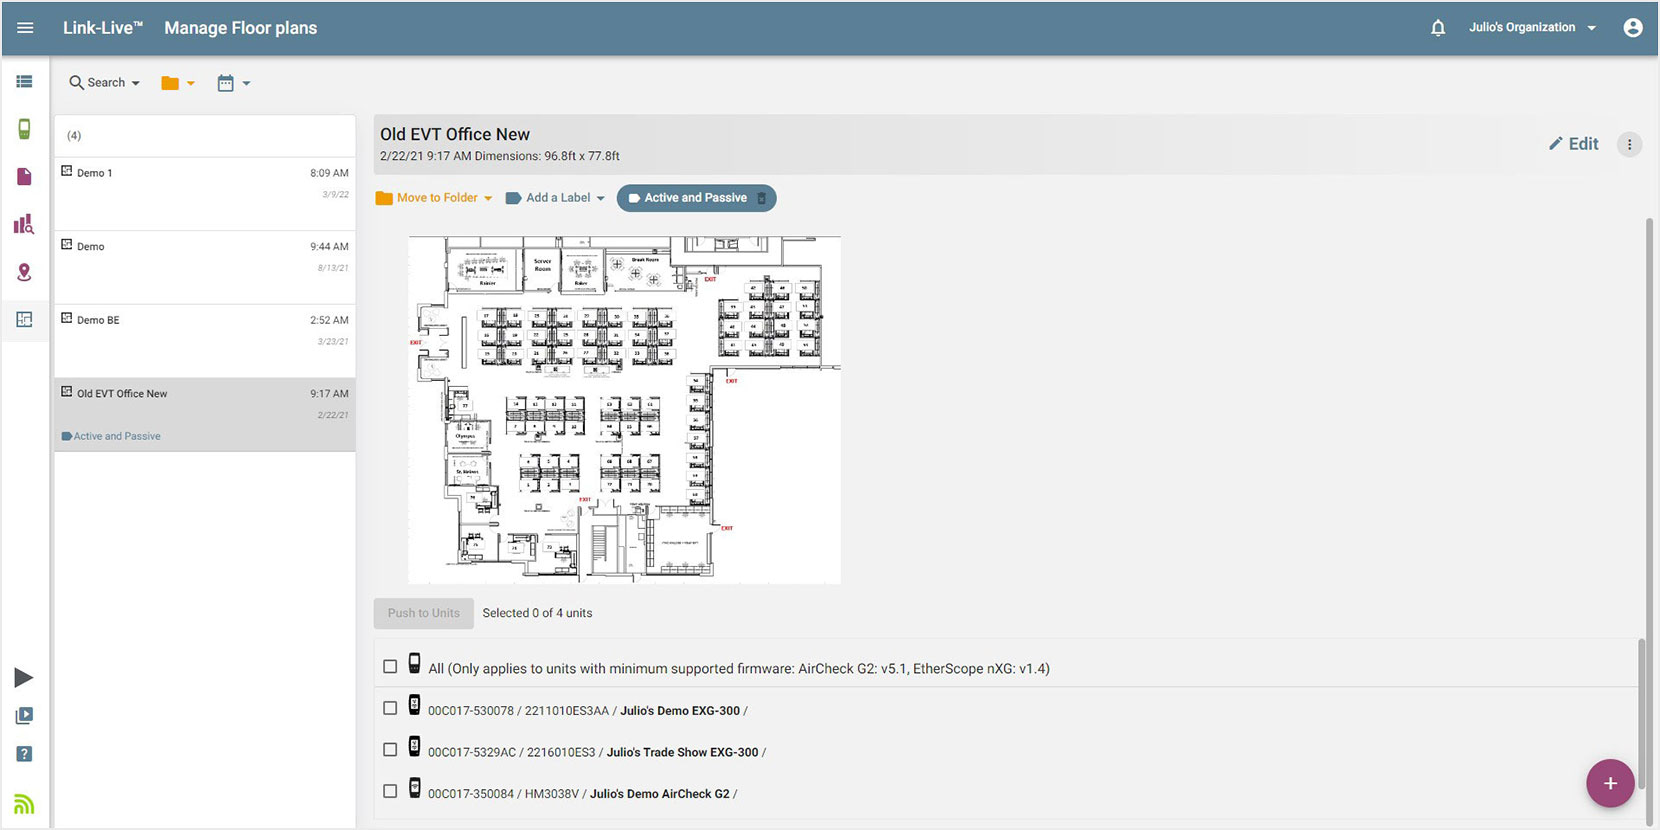
Manage Floor Plan
Screen: Create site survey projects in Link-Live and push pre-configured floor plans to testers on the field. You can upload floor plans, crop images, calibrate, and provide signal propagation information.
Benefits: Simplifies the process or collaborating with remote surveyors and removes the need for special training. Surveyors in the field just need to tap on the screen and collect data points.

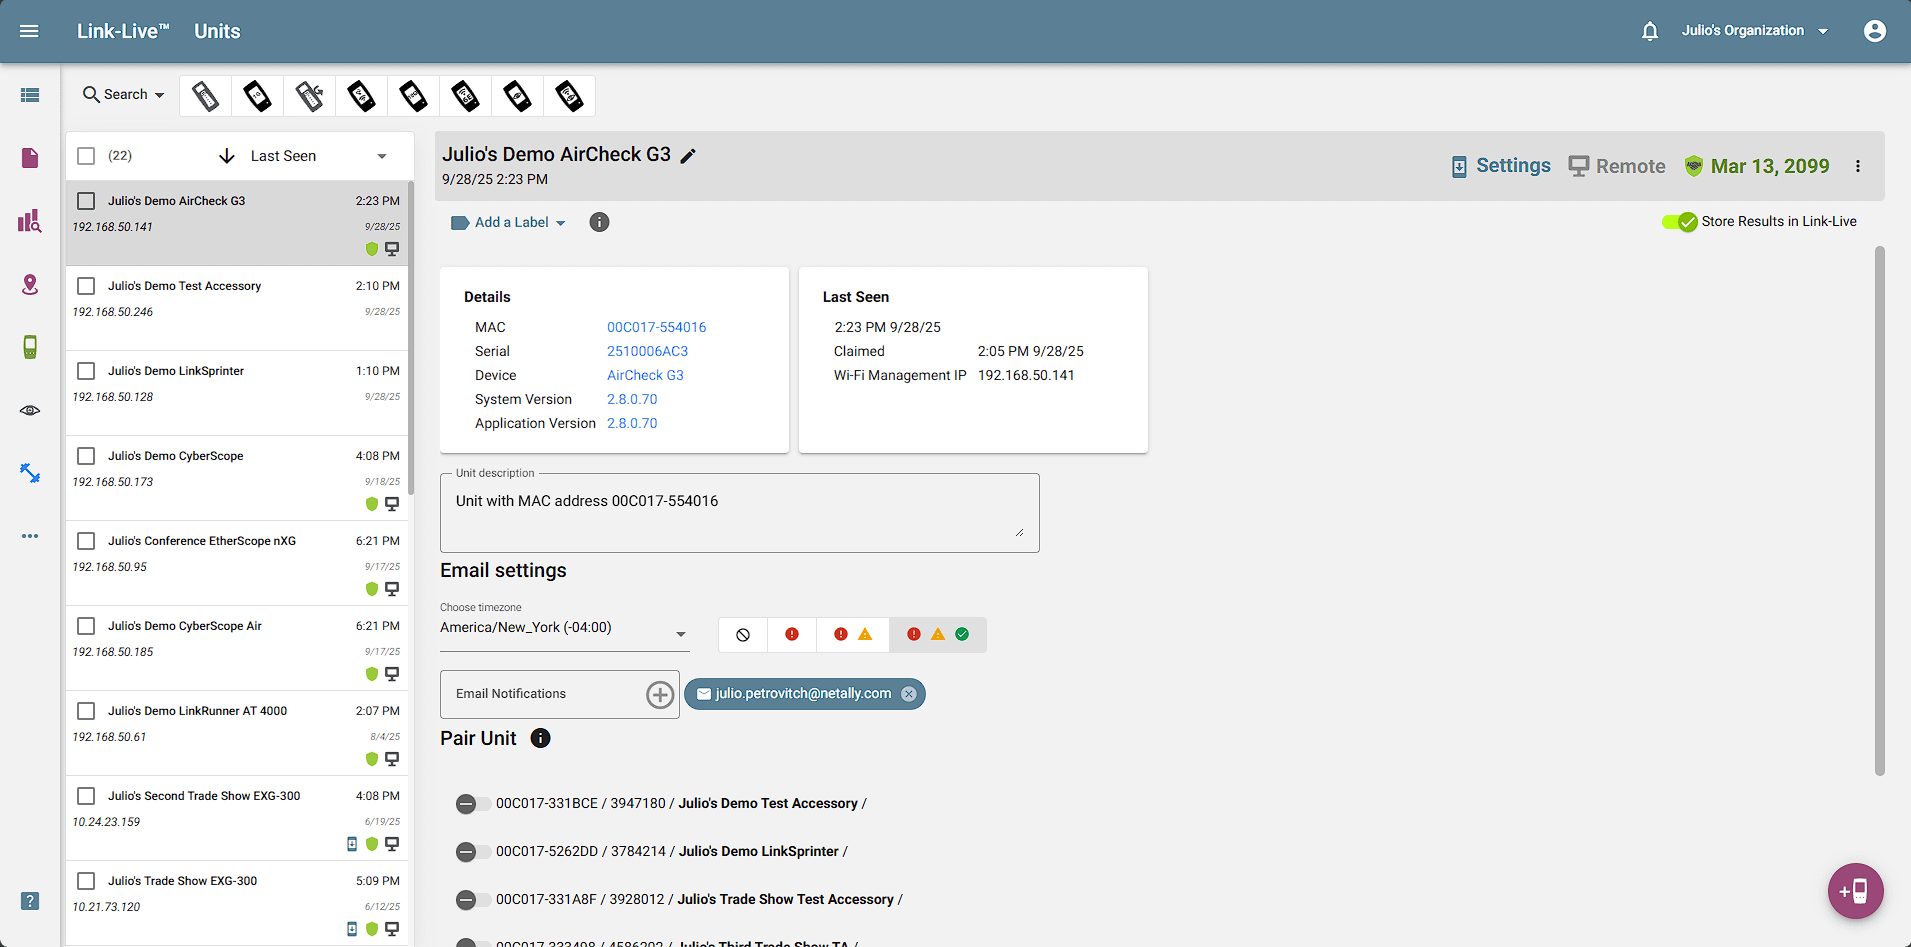
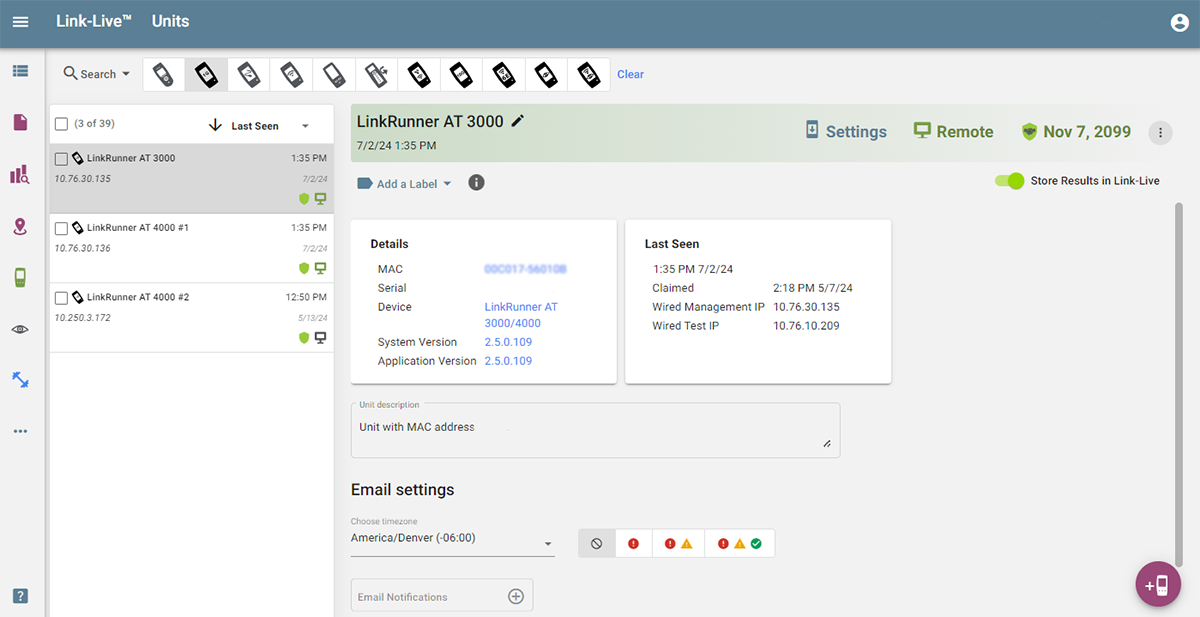
Units
Screen: View information on your currently claimed testers’, change the unit name and description, add labels, and modify email addresses that receive test results.
Benefits: Keep track of different testers, assign email addresses to get live updates of testing performed from certain units, auto-label results from a unit, change the name of each unit to best track who has been performing tests, and optimize collaboration efforts.
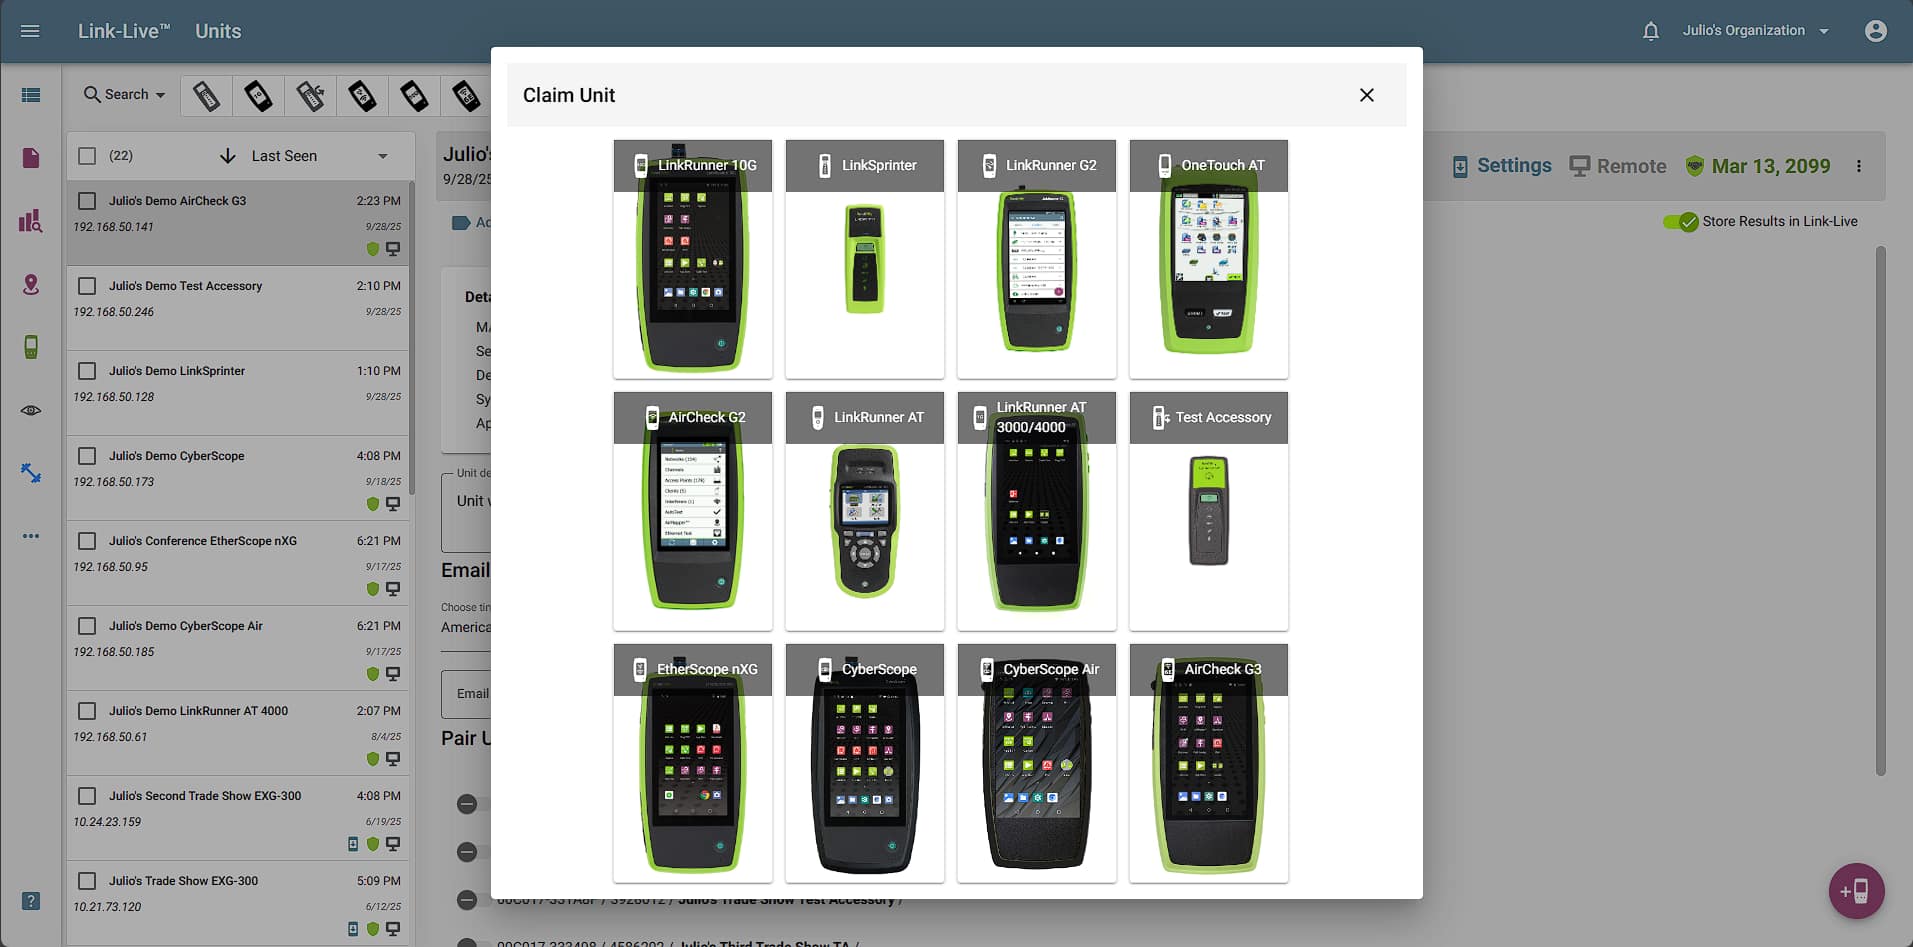
Claim a Unit
Screen: Here you can claim units to be tracked by your Link-Live Organization.
Benefits: Add a unit to your organization to collect and organize test results from multiple testers, assign email addresses to get live updates of testing from certain units, change the name of each tester to best track who has been performing tests, and optimize collaboration efforts.
Analysis
Screen: On this page, various file types uploaded from NetAlly testers can be analyzed, including discovery, path analysis, and WiFi sessions.
Benefits: Centralized experts can analyze complex network data collected from testers used by technicians in the field; this includes generating network topology diagrams, seeing what devices have changed (added or missing) between two discovery files, path analysis results, and in-depth WiFi network analytics.
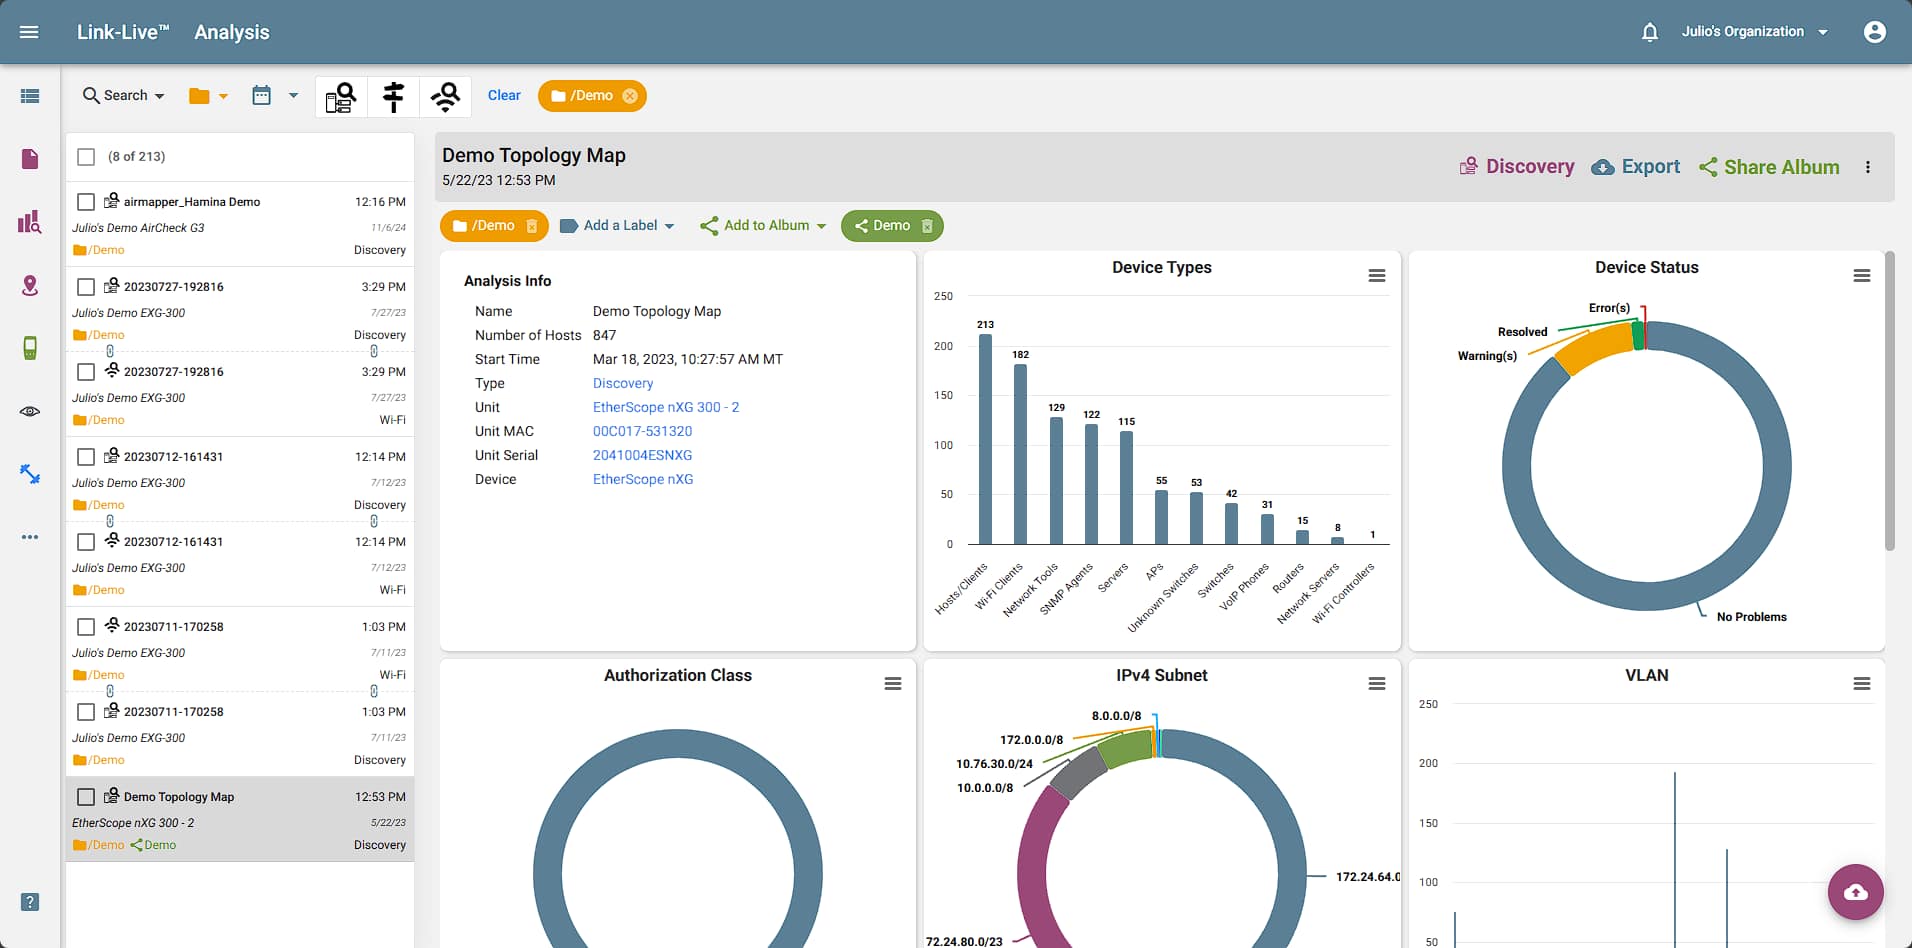
Analysis – Network Topology
Screen: Instantly map your wired and WiFi networks with discovery data from AirCheck G3, EtherScope nXG, or LinkRunner 10G (with AllyCare). Discovery Difference automatically shows devices that are new since the last Discovery, and devices that have gone missing.
Benefits: Having an up-to-the-minute accurate network diagram speeds troubleshooting and network changes, simplifies discovery of unauthorized devices and keeps network documentation up-to-date.
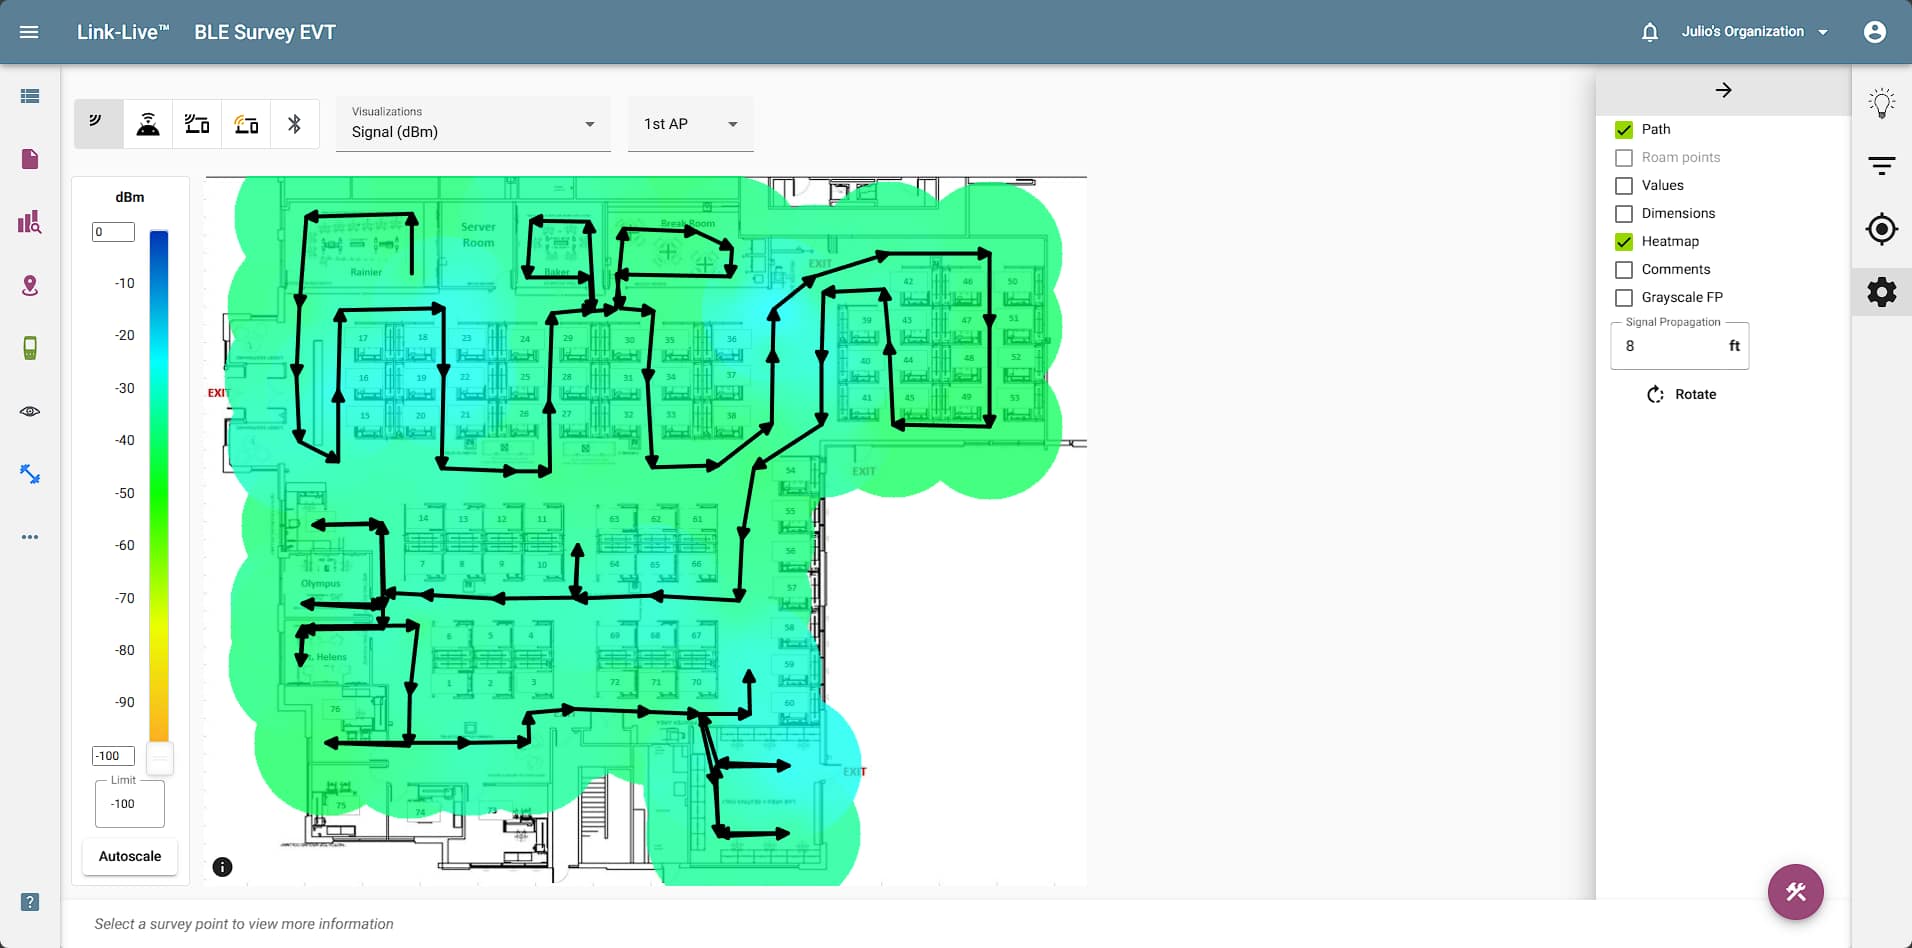
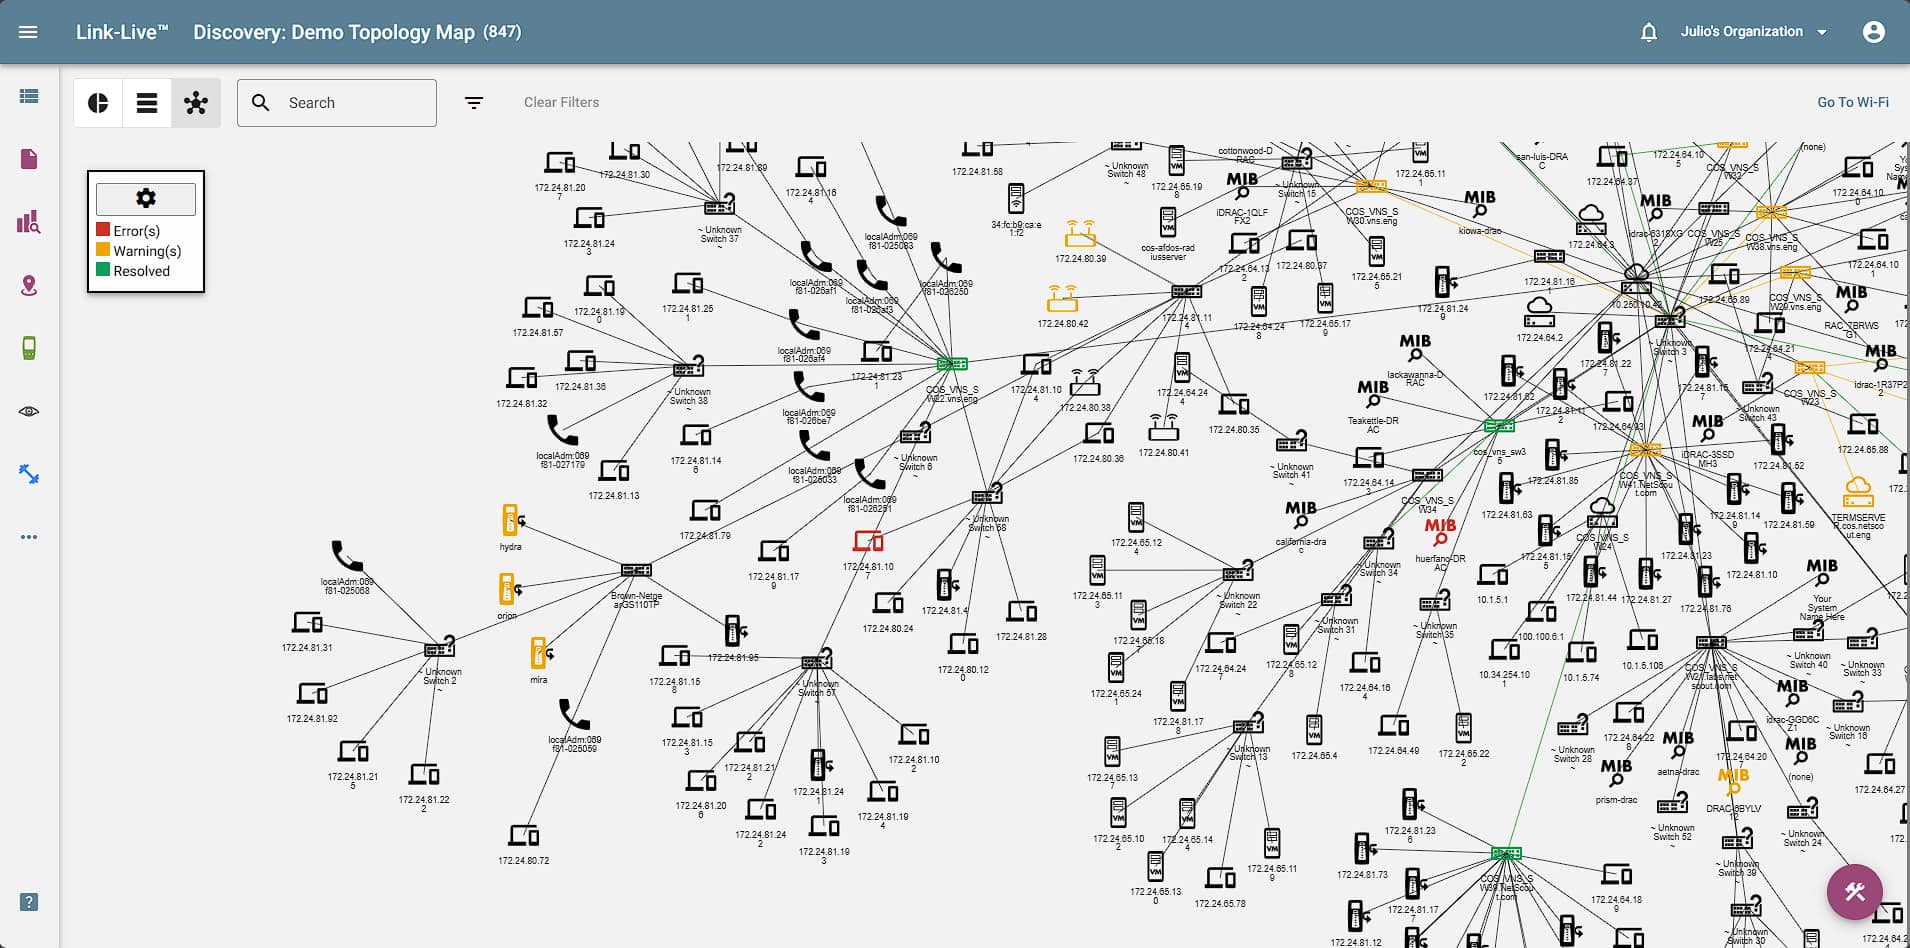
AirMapper™ Site Survey
Screen: Quickly create powerful visualizations from location-based site data recorded with the AirMapper Site Survey app on EtherScope nXG or AirCheck G3. Ideal for new deployments, change validation and performance verification. Instantly modify views with custom filters and thresholds.
Benefits: The various visualizations provide fast insight into various factors of WiFi network coverage and performance. Once configured the way you like, the view can instantly be saved as a template for later recall (without having to re-configure the view) or to add to a report (icon at lower right), making network documentation fast and easy.
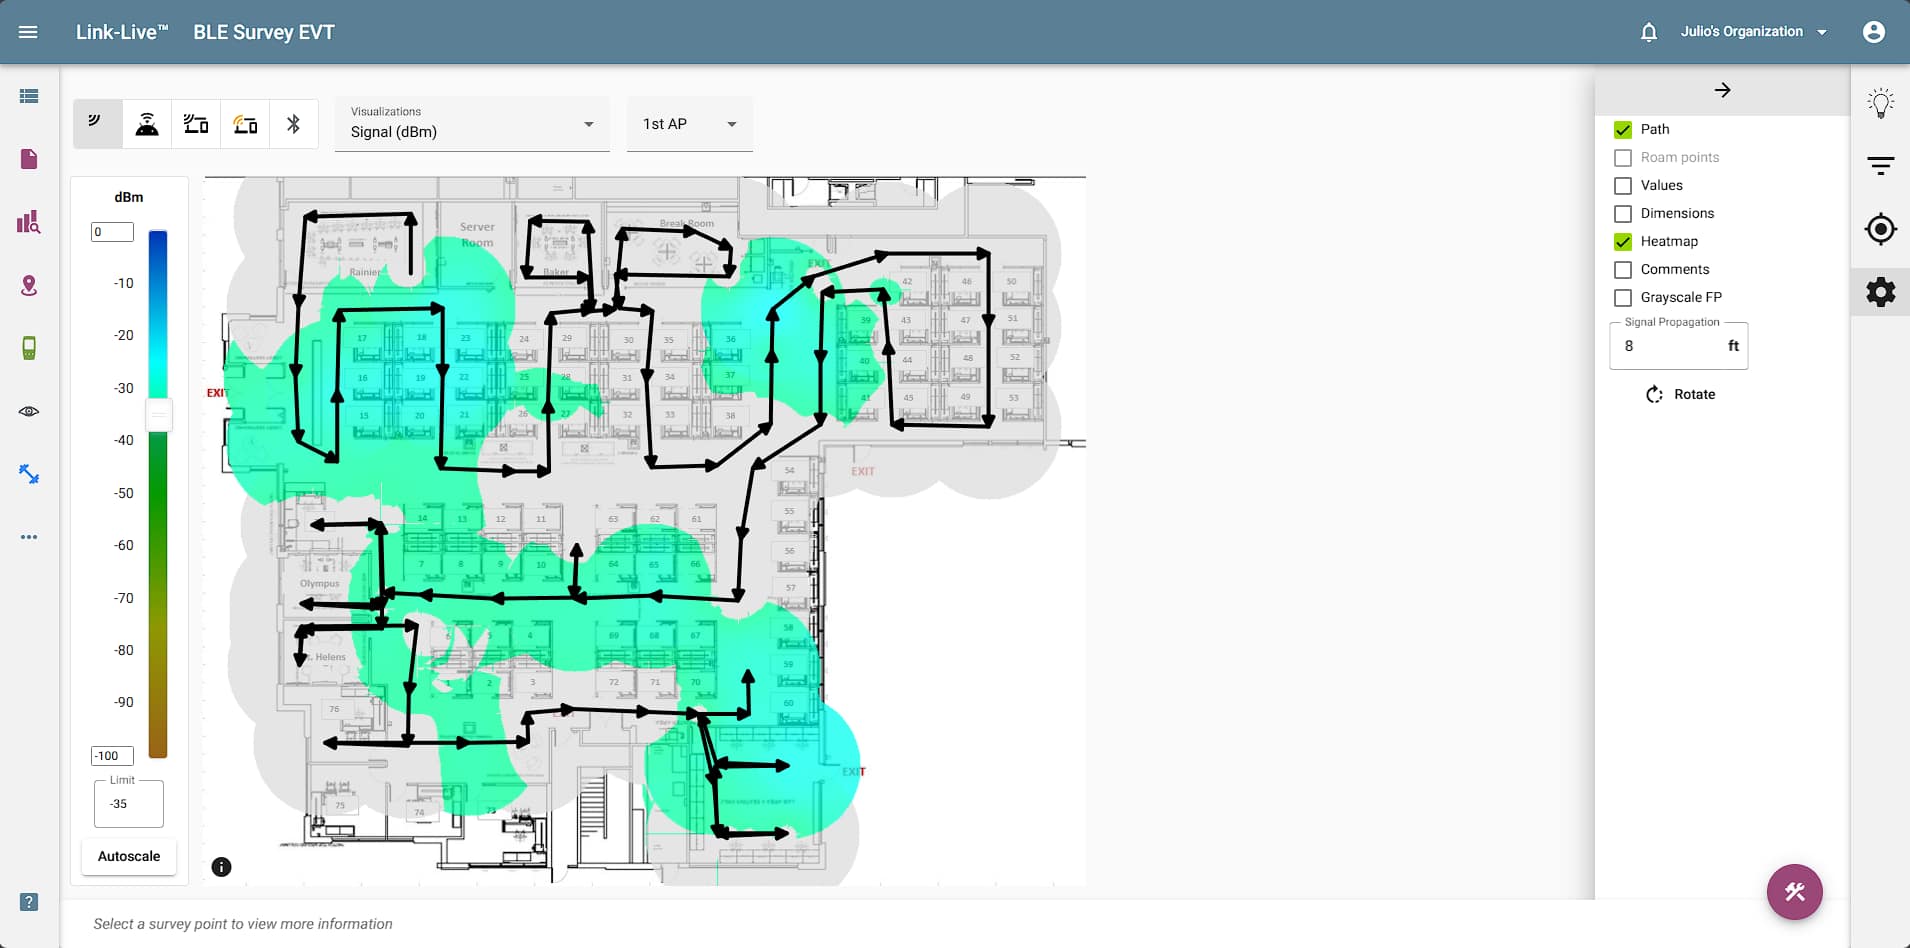
Setting Threshold Levels
Screen: By adjusting the dBm value using the slider or by entering a value in the box below, set the threshold level for the visualization shown. Areas on the survey that do not meet the threshold value will turn gray. Clicking the “Values” option in the control box will show the relevant measurement for each survey point.
Benefits: Validating your network meets minimum requirements ensures coverage and performance for all users. By varying the threshold value, you can easily see which areas of the site would be impacted first by a degradation of service. The simplicity of threshold settings in AirMapper provides quick visibility into potential problem areas.
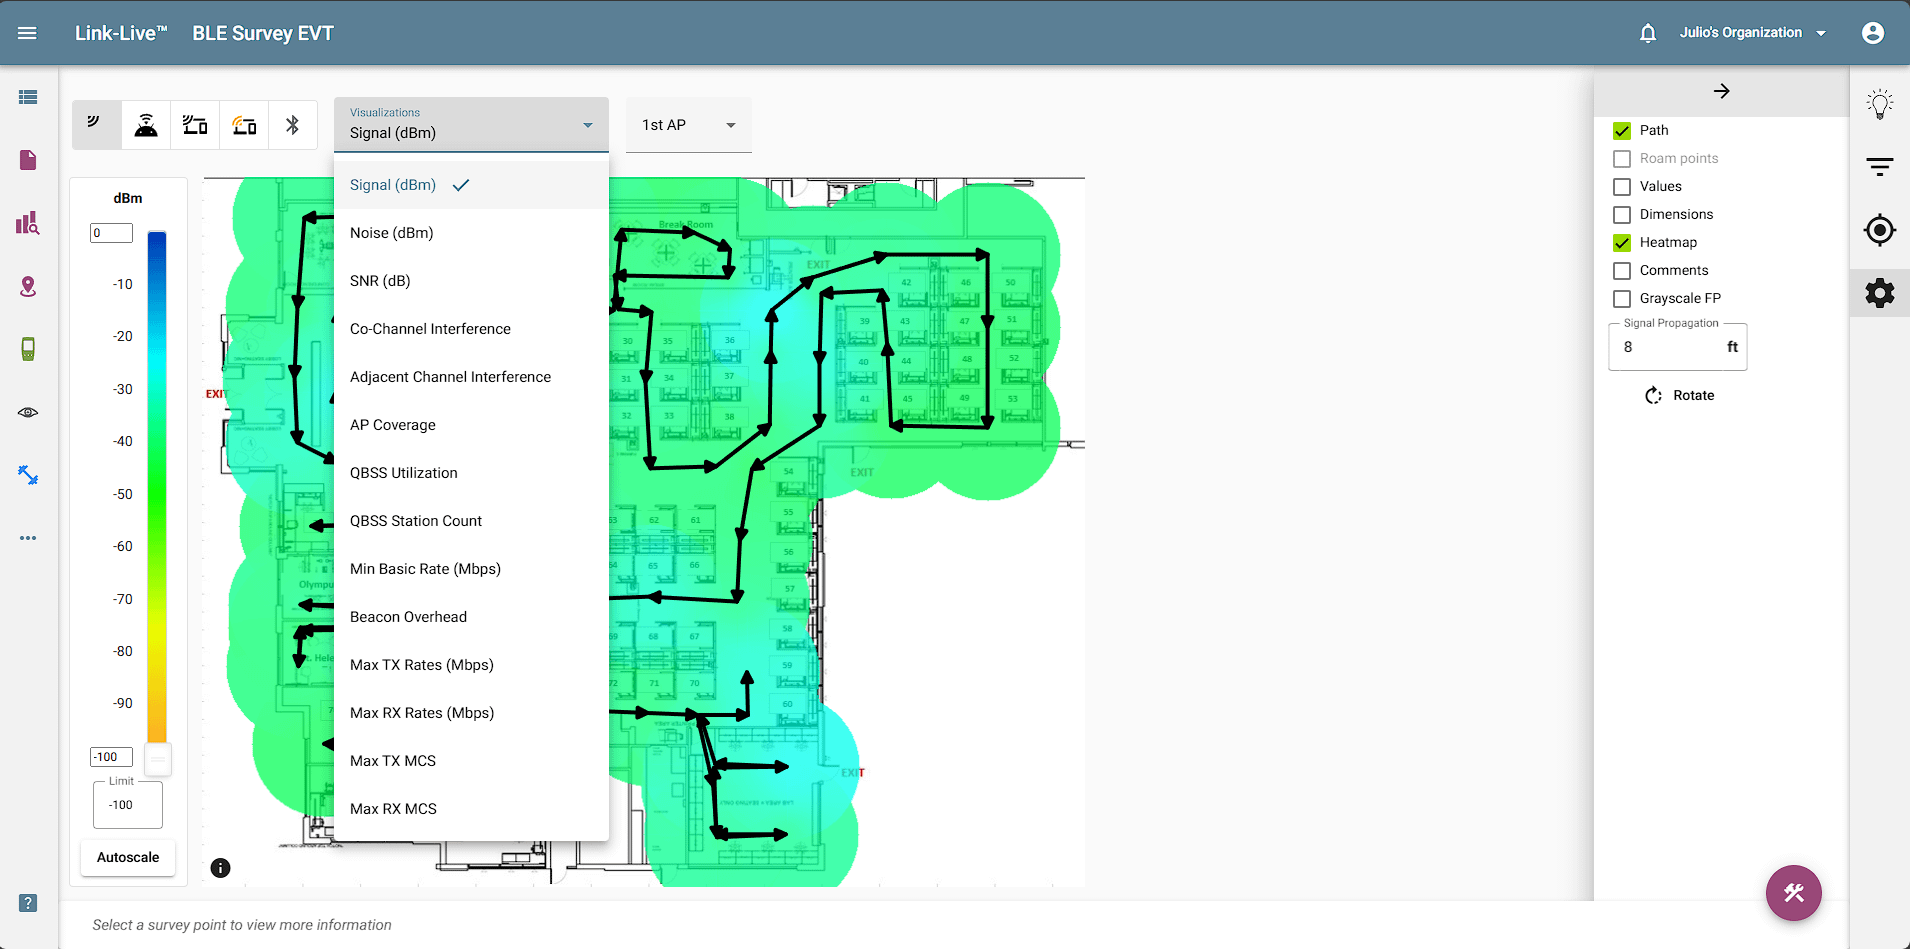
Heatmap Visualization Options
Screen: Selecting the Options dropdown shows the visualizations available. By default, every user has access to the Signal (coverage) heatmap. Additional visualizations require an active AllyCare Premium Support contract or a Link-Live Enabled Features subscription. These include Noise, SNR, Co-Channel and Adjacent Channel Interference, AP Coverage, Data Rates, Beacon Overhead, and Max Tx/Rx MCS.
Additional customization of the view includes whether to show the survey path, show the key value for each sample point, show AP location, and show comments. (Comments can be used by the surveyor to communicate key information about the site or survey to the survey analyst, or otherwise document critical information about the survey.)
Benefits: The various visualizations provide fast insight into various factors of WiFi network coverage and performance. Once configured the way you like, the view can instantly be saved as a template for later recall (without having to re-configure the view) or to add to a report (icon at lower right), making network documentation fast and easy.
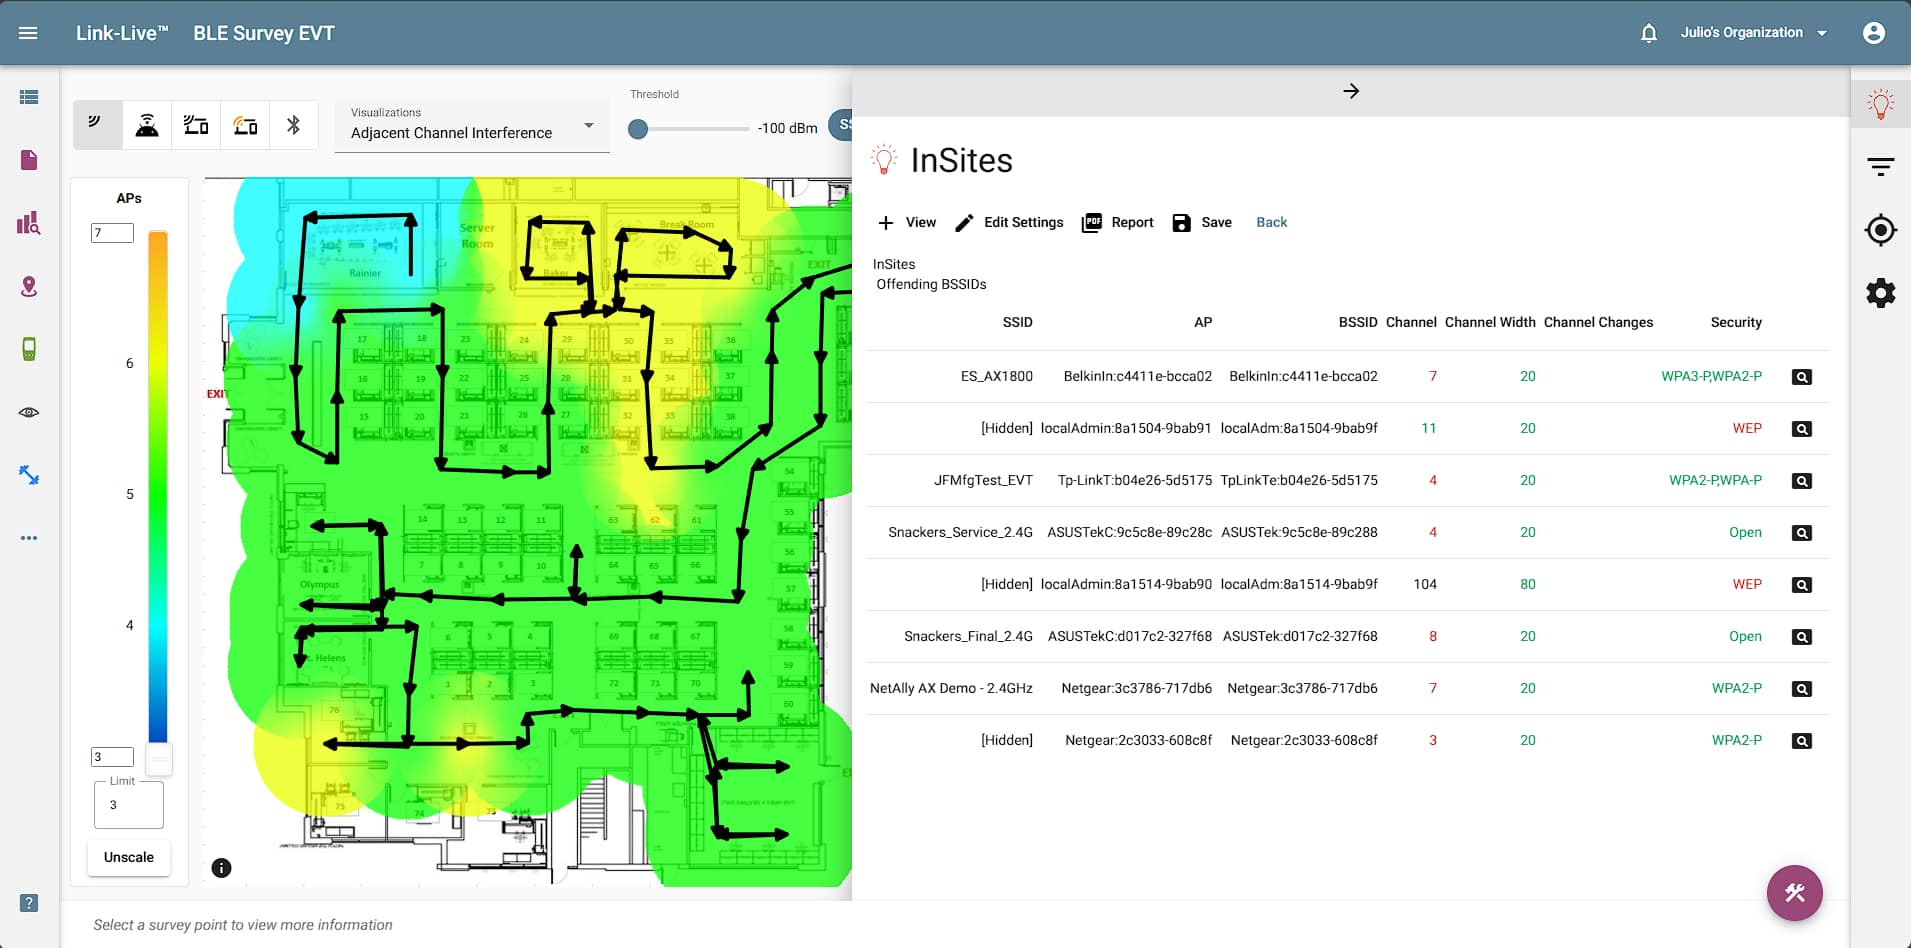
AirMapper InSites™ Intelligence
Screen: InSites simplifies the process of WiFi network validation and troubleshooting by automatically comparing the AirMapper Site Survey data collected on-site to a set of pre-defined (user customizable) thresholds, providing a visual Pass or Fail indication on the heatmap.
Benefits: There is no need to be an expert to analyze WiFi heatmaps and identify wireless network problems anymore. The InSites intelligence in Link-Live now makes it easy for anyone to quickly identify WiFi network problems.
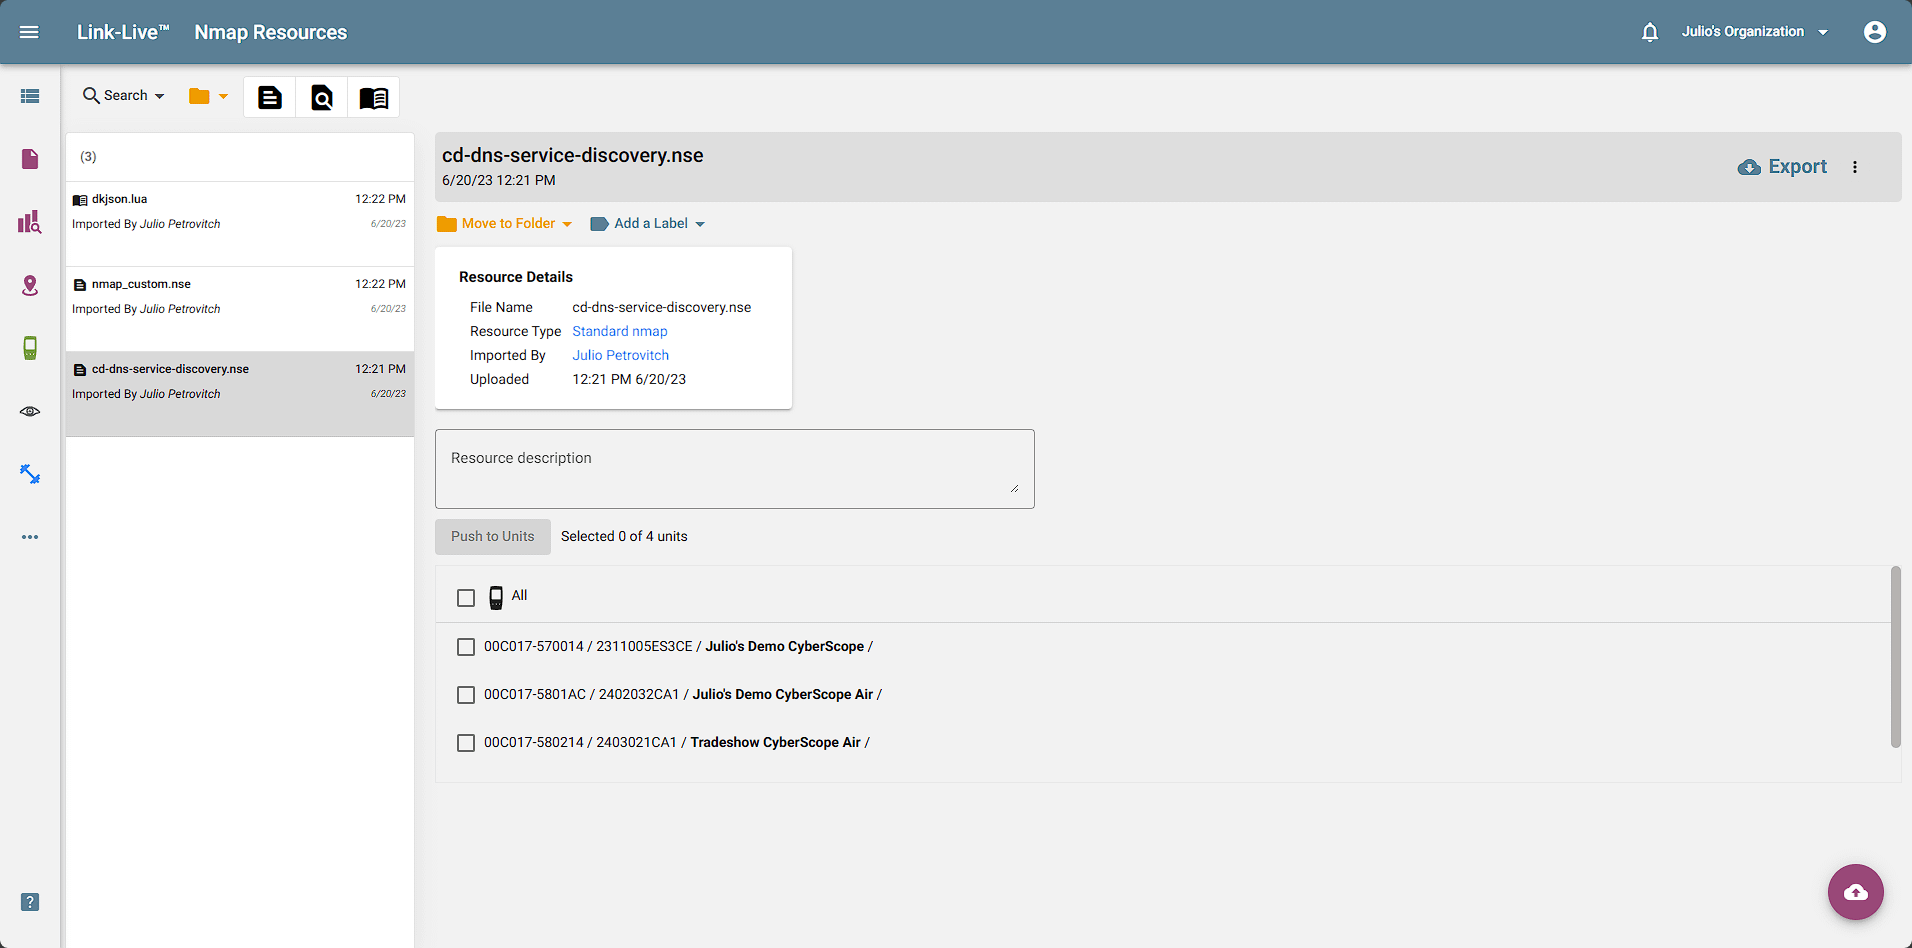
Nmap Resources
Screen: This is the Nmap resources screen, it can be used to save Nmap custom scripts and share them with other team members. It is only available when a CyberScope unit has been claimed to Link-Live.
Benefit: Simplifies the process of collaborating with other team members and allows for consistency when scanning for network vulnerabilities using different CyberScope units.
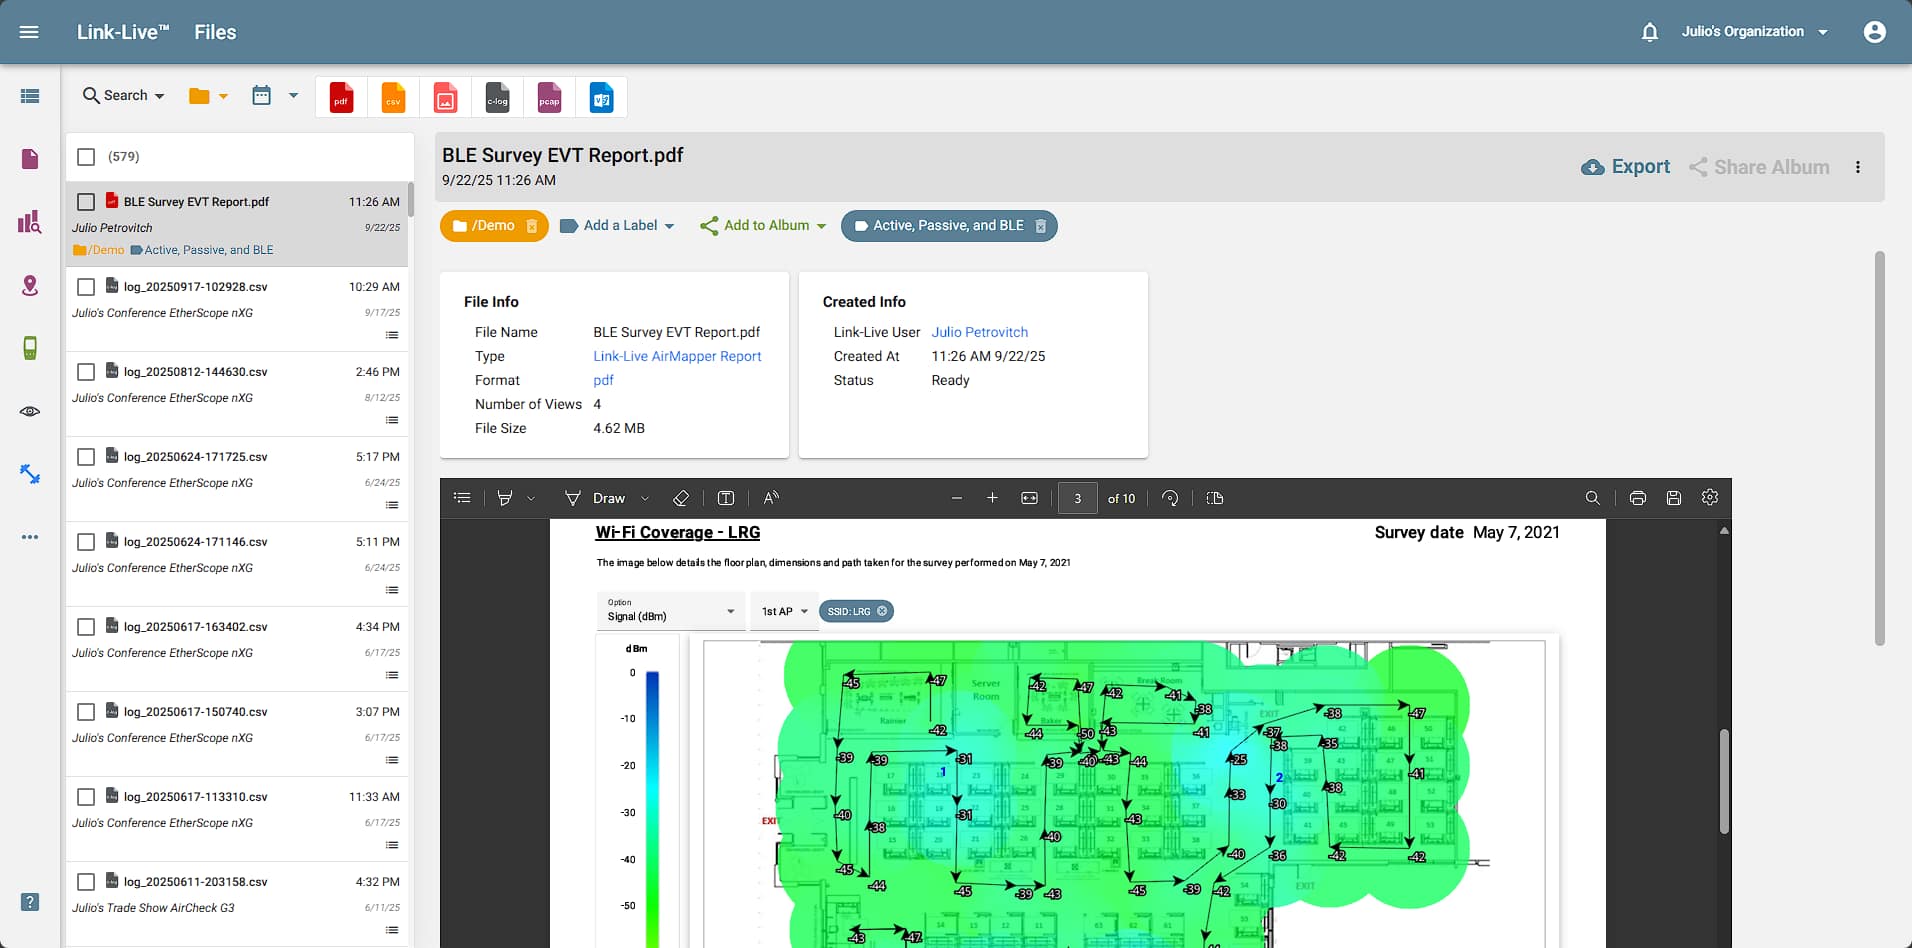
Uploaded Files
Screen: On this page, you can view reports you have created using the Result Dashboard, AirMapper app, Analysis app, etc. From here you can also access screenshots, photos, log files, and packet captures that have been uploaded to Link-Live.
Benefit: Instantly generate and view graphical summaries from test results to provide proof of network connectivity, installation, and validation.
Models
| Model | Description |
|---|---|
| LL-PRVT-G* | Link-Live Private Edition, software download |
| LL-PRVT-SUB* | Link-Live Private Edition, yearly subscription; includes AllyCare Product Support. |
| LINKLIVE-EF-SUB-3YS** | Link-Live Enable Features, enables in-depth functionality in Link-Live or Link-Live Private, three-year subscriptions |
*Both items are required for complete installation and use of the Link-Live Private solution.
**Only available for AirCheck® G2.
Documents
Flyers
| Title/Description | Download |
|---|---|
Link-Live Product Flyer | Download |
AllyWare Common Technology Guide | Download |
Link-Live v9.1 Release Notes | Download |
Link-Live Security Overview | Download |
Manuals
| Title/Description | Download |
|---|---|
Link-Live Private User Guide | Click To View |
| Link-Live Private Device Claiming Process | Download |
Software
| Title/Description | Download |
|---|---|
Link-Live Result API Guide | Download |
Capabilities
Testers Supported by Link-Live™
| Models | Description | Link-Live™ Cloud | Link-Live™ Private |
| LSPRINT-300 | LinkSprinter® Pocket Network Tester | • | n/a |
| LRAT-3000 | LinkRunner® AT 3000 Network & Connectivity Tester | • | • |
| LRAT-4000 | LinkRunner® AT 4000 Smart Network & Cable Tester | • | • |
| LR10G-200 | LinkRunner® 10G Advanced Ethernet Tester | • | • |
| AIRCHECK-G3-PRO | AirCheck® G3 Pro Wireless Analyzer | • | • |
| EXG-300 | EtherScope® nXG Portable Network Expert | • | • |
| CYBERSCOPE-AIR | CyberScope® Air WiFi Vulnerability Scanner & Tester | • | • |
| CYBERSCOPE-XRF | CyberScope Ethernet Vulnerability Scanner & Tester | • | • |
| CYBERSCOPE-CE | CyberScope Edge Network Vulnerability Scanner & Tester | • | • |
System Requirements - Link-Live™ Cloud and Private
Browser
Latest version of Chrome, Firefox, Safari, Edge, Internet Explorer. For best experience, use Chrome.
Server Requirements - Live-Live™ Private
| Hardware | Minimum Requirements | Recommended |
|---|---|---|
|
Disk Space |
150GB | 300GB |
Memory |
12G | 24GB |
Processor |
4 Cores @ 1.4GHz | 8 Cores @ 2.0GHz or faster |
| Software | Technology | Minimum Version | Linux | Ubuntu | 20.04 | Docker | Client/Server | 20.10.2 | Docker | Compose | 1.25.0 |